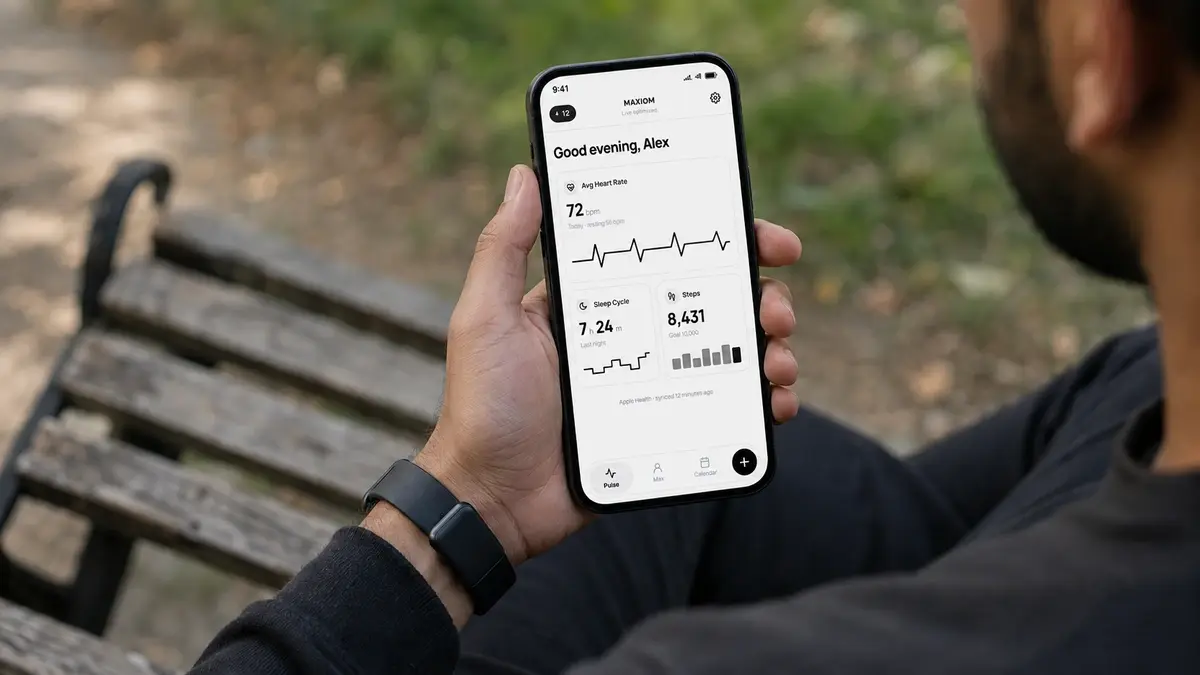
If you wear a fitness tracker, you have probably seen a number labeled HRV sitting next to your sleep score every morning. Some days it is 62. Some days it is 34. And unless someone has explained what that number means, it is easy to either ignore it completely or panic about it unnecessarily.
Heart rate variability is one of the most useful signals your body produces. It is also one of the most misunderstood, largely because people compare their number to a stranger's number instead of to their own history.
This guide covers what HRV is, how it changes with age, what a normal range looks like across each decade, and what actually moves the needle.
What HRV Measures
Your heart does not beat like a metronome. Even at a steady 60 beats per minute, the gap between individual beats varies. One interval might be 1,020 milliseconds, the next 980, the next 1,045.
HRV is the measurement of that variation, expressed in milliseconds.
Those fluctuations are controlled by your autonomic nervous system, which has two branches. The sympathetic branch handles stress and activation, often described as fight or flight. The parasympathetic branch handles recovery and digestion, often described as rest and digest. HRV largely reflects parasympathetic activity, which is why it works as a proxy for how recovered you are.
Higher variability generally signals a nervous system that can adapt and shift gears. Lower variability tends to signal a body under load, whether from training, illness, poor sleep, alcohol, or psychological stress.
Two metrics come up most often. RMSSD is the one most consumer wearables report, and it primarily captures parasympathetic activity. SDNN captures overall variability across both branches and shows up more often in clinical settings. When your device shows you an HRV number, it is almost always RMSSD.
HRV Declines With Age, and That Is Normal
This is the part that surprises people. HRV drops steadily across the lifespan, and it does so in essentially every population that has been studied.
A study of 300 healthy adults in Seoul aged 19 to 69 found that every HRV index measured showed a decreasing trend with age, matching what has been observed in Western populations. The same study found no significant gender difference in any HRV parameter across the age groups, though other datasets do show men running slightly higher than women until roughly age 50.
Consumer wearable data tells the same story at much larger scale. Population-based research consistently confirms that HRV declines with age, and some evidence suggests the decline is less severe in healthier individuals.
That last point matters. Some of the drop is baked into the aging process. Some of it is a function of fitness, sleep, body composition, and stress load, which means part of it is within your control.
HRV Range by Age
Here is roughly where people land by decade. These are drawn from large wearable datasets and clinical reference values, and they represent typical ranges rather than targets.
| Age range | Typical RMSSD (ms) |
|---|---|
| Teens and 20s | 55 to 105 |
| 30s | 50 to 60 average |
| 40s | 40 to 45 average |
| 50s | 30 to 35 average |
| 60s | 25 to 45 |
| 65+ | Often below 30 |
To put ranges around the averages, the middle half of 25 year old men typically fall between 50 and 100 ms, while 45 year old men sit closer to 35 to 60 ms. Women of the same ages follow a similar curve, from roughly 45 to 90 ms down to 30 to 55 ms.
The spread widens further at the population level. The most common HRV reading among men in one large wearable dataset was around 40, with the most frequent value for women at 37, and a small number of people, often elite athletes, averaging 160 or higher.
Reference data from clinical five minute recordings tends to run lower than wearable overnight readings, which is why numbers vary between sources. One normative database of 467 healthy participants aged 8 to 69 reported an average SDNN of about 45 ms and RMSSD of about 27 ms. Measurement conditions change the number substantially, so comparing a five minute seated reading to an overnight wearable average is not a fair comparison.
One interesting wrinkle: the decline is not perfectly linear. Research from the Baependi Heart Study found that SDNN decreased linearly with age, but parasympathetic measures like RMSSD followed a U shaped curve, reaching their lowest point around age 53 before showing a slight reversal upward after 60.
Why the Chart Matters Less Than Your Baseline
Here is the most important thing to understand about every chart above, including this one: it is close to useless for judging whether your individual HRV is good.
HRV varies enormously between people for reasons that have nothing to do with health. Genetics, body size, breathing rate, measurement method, and device algorithm all shift the absolute number. Two equally fit 40 year olds can sit 40 ms apart.
What actually carries information is your own trend. A reading of 45 means one thing if your baseline is 40 and something very different if your baseline is 70. A single low night is usually noise. A sustained downward drift over two or three weeks is signal, and it typically points to accumulated training load, poor sleep consistency, illness, or elevated life stress.
Common drivers of a lower reading include intense exercise the previous day, alcohol, eating late, dehydration, inconsistent sleep timing, and psychological stress. Alcohol in particular tends to produce a dramatic and unmistakable drop.
The practical approach: establish a baseline over two to four weeks of consistent overnight measurement, then watch for meaningful deviations from that baseline rather than checking your number against a chart.
This is where a connected coach earns its place. Max AI syncs directly with Apple Watch, Oura, Whoop, Garmin, and Fitbit, so your baseline builds itself from continuous overnight data instead of you eyeballing a graph. When your reading drops, the relevant question is what else moved, and Max AI already has the training, sleep, and nutrition context sitting alongside it.
What Actually Raises HRV
The evidence points consistently in a few directions.
Aerobic training. Regular cardiovascular exercise is the most reliable long term lever. A study of physical activity domains found that sports participation was positively associated with both SDNN and RMSSD, and leisure time activity showed similar positive relationships. Improvement takes months, not days.
Sleep quality and consistency. In a 14 day study of daily morning HRV readings, researchers found that higher RMSSD was associated with better self reported sleep, lower fatigue, and reduced stress, even after adjusting for covariates. Going to bed and waking at consistent times matters as much as total duration.
Managing training load. Chronically low HRV in someone training hard usually means the recovery side of the equation is undersupplied. Backing off intensity for a few days often restores it, though the fix is often nutritional rather than purely a matter of resting more. We covered how Max AI adjusts meals and sessions to what your body is actually signalling in Adaptive Recovery Nutrition.
Reducing alcohol. Few interventions show up in the data as quickly.
Fueling and hydration. Underfueling and chronic dehydration both suppress HRV, and both are easy to miss without a record of what you actually ate. Max AI's photo based meal logging makes that record cheap enough to keep, which is what turns intake into something you can correlate against your recovery trend.
Breathwork. Slow paced breathing at around six breaths per minute directly stimulates parasympathetic activity and can raise readings acutely.
None of these produce overnight change. HRV responds to patterns sustained over weeks.
The Problem With Asking a Chatbot About Your HRV
If you paste your HRV number into a general AI chatbot and ask whether it is good, you will get the chart. You will get the population range for your age, a note that HRV is individual, and a suggestion to talk to your doctor.
That is not wrong. It is just not useful, because the chart was never the answer.
The question that matters is whether your HRV has moved relative to your own history, and what changed in your life that might explain it. Answering that requires knowing your baseline, your training load over the past few weeks, your sleep pattern, your alcohol intake, any medications you take, and any conditions you manage. A general AI chatbot does not have any of that. It starts every conversation from zero.
There is a second problem. A general AI chatbot will answer confidently whether or not it has the information to answer well, and with health questions that confidence is doing real work on the reader. We wrote about that failure mode in more depth in Why Generic AI Gives Dangerous Health Advice.
This is the specific gap Max AI was built to close. It holds a persistent profile of your conditions and medications, both of which affect autonomic function directly. Beta blockers, thyroid medication, SSRIs, and stimulants all shift HRV, and a coach that does not know you take them will misread your data every time. Max AI also reads your lab and blood work PDFs, so thyroid function, iron status, and inflammatory markers are part of the picture rather than missing variables. A low HRV trend alongside low ferritin and a suppressed TSH is a different conversation than a low HRV trend after a heavy training block.
When your HRV drops for four straight nights, the useful response is not a definition of RMSSD. It is a look at what your training, sleep, fueling, and recovery data did over those same four nights, and what that pattern suggests you should change this week.
The Short Version
HRV declines with age, and that decline is normal. Typical values move from the 55 to 105 ms range in your 20s down toward 25 to 45 ms by your 60s, with wide individual variation at every age.
Your absolute number tells you very little. Your trend against your own baseline tells you a great deal. Build that baseline over a few weeks, watch for sustained shifts rather than single day dips, and address the inputs that actually move it: aerobic fitness, sleep consistency, training load, and alcohol.
Frequently Asked Questions
What is a good HRV for my age?
There is no single good number. Typical RMSSD runs 55 to 105 ms in your 20s, around 50 to 60 ms in your 30s, 40 to 45 ms in your 40s, 30 to 35 ms in your 50s, and 25 to 45 ms in your 60s. But the spread within any age group is wide enough that the average is close to meaningless for an individual. A 45 ms reading is strong for one 40 year old and a warning sign for another. Compare against your own baseline, not the chart.
Why is my HRV lower than my friend's if we are the same age and fitness level?
Genetics, body size, resting breathing rate, and device algorithm all shift the absolute number independently of health. Two equally fit people the same age can differ by 40 ms with neither one having a problem. Cross person comparison is the single most common mistake people make with this metric.
Is low HRV always bad?
No. A single low night is usually noise and often traces to something obvious like a hard session, a late meal, alcohol, or a short night. What matters is a sustained downward drift across two or three weeks, which typically points to accumulated training load, disrupted sleep, illness, or elevated stress.
Can you actually improve HRV, or does age just win?
Both are true. Part of the decline is intrinsic to aging, and part of it tracks fitness, sleep, and stress load. Evidence suggests the age related drop is less pronounced in healthier people. Aerobic training is the most reliable long term lever, though it works over months rather than days.
Why does HRV drop so much after drinking?
Alcohol suppresses parasympathetic activity through the night and pushes your body toward a sympathetic dominant state during the hours it should be recovering. It is one of the most visible and reproducible effects in HRV data, often showing up as a 20 to 30 percent drop the following morning.
What is the difference between RMSSD and SDNN?
RMSSD reflects parasympathetic activity specifically and is what nearly every consumer wearable reports. SDNN captures overall variability across both branches of the autonomic nervous system and appears more often in clinical work. They are not interchangeable, and RMSSD is usually the more actionable of the two for day to day recovery.
Why do my numbers differ between devices?
Measurement window and algorithm. A five minute seated clinical reading and an overnight wearable average are measuring different things under different conditions, and different manufacturers sample at different points in the night. Pick one device, stay with it, and treat the trend as the data rather than the absolute value.
How long does it take to establish a baseline?
Two to four weeks of consistent overnight measurement. Before that, you do not have enough data to know what a deviation looks like.
Can medication affect my HRV?
Yes, significantly. Beta blockers, thyroid medication, antidepressants, and stimulants all influence autonomic function. This is exactly why context matters when interpreting a reading, and why Max AI keeps your medications and conditions in a persistent profile rather than asking you to re-explain them every time.
This article is for informational purposes and is not medical advice. If you have concerns about your cardiovascular or autonomic health, consult a qualified healthcare provider.